The roots of statistics are often traced back to probability theories. This is true, but one area of statistics is a direct reflection of a completely different area of mathematics, i.e., linear algebra.
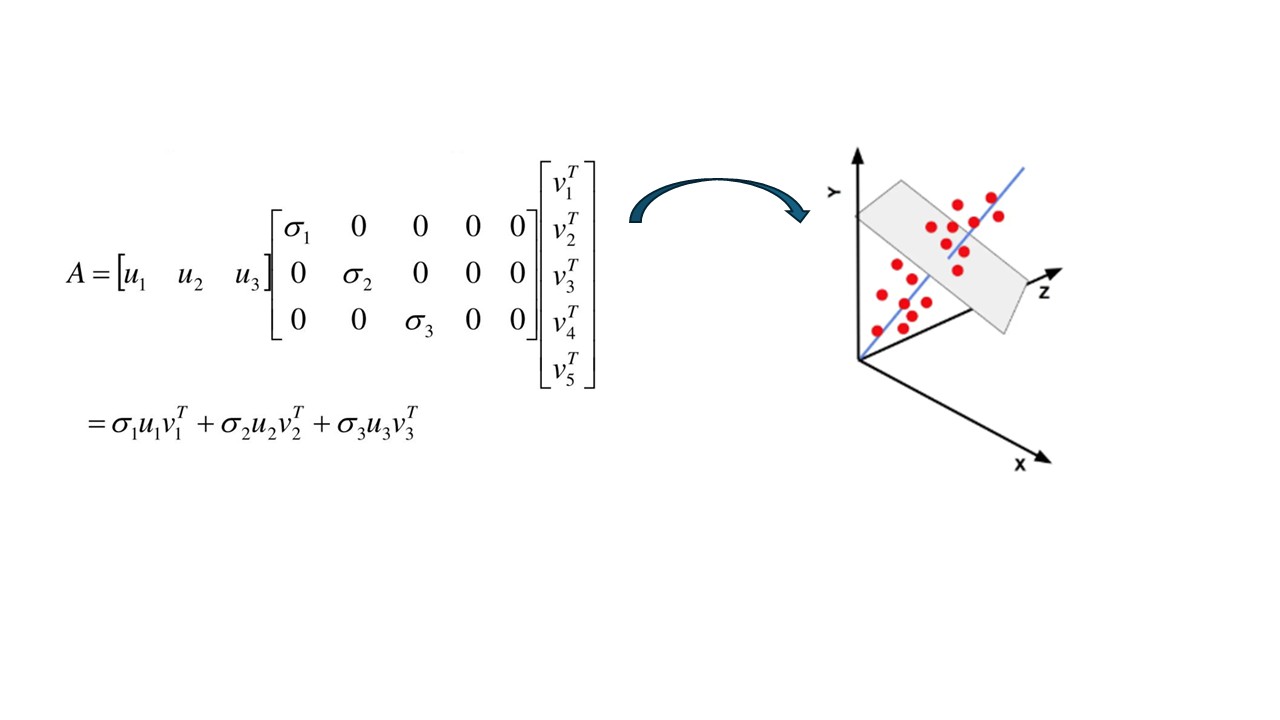
Linear algebra had a profound impact on the whole area of multivariate statistics, to the extent that numerous multivariate methods are effectively direct copies of some of the key theorems from linear algebra. We are talking about methods, such as Principal Component Analysis (PCA), Factor Analysis, Singular Spectrum Analysis (SSA), Multidimensional Scaling (MDS), Cluster Analysis, Canonical Correlation Analysis (CCA), MANOVA, etc., to mention just a few.
Many data analysis packages, compression packages, machine learning, and the whole area of Artificial Intelligence (AI) would simply not exist if these methods were not lifted from linear algebra and proceduralised as multivariate statistical methods.
Understanding how linear algebra works in this context and what is happening with vectors and matrices opens up a new way of gaining insight into certain areas of statistics. To do this, one has to understand the language of linear algebra. This tutorial will provide precisely this, but rather than focusing on theorems, it uses Excel to demonstrate all the operations and how some of the multivariate principles have been adopted to make this area of mathematics work in statistics. In summary, the tutorial is aimed at non-mathematicians and all those not too comfortable with equations and proofs.
The spreadsheets with all the calculations are placed here, and the paper containing the tutorial in PDF format can be downloaded or viewed from here.