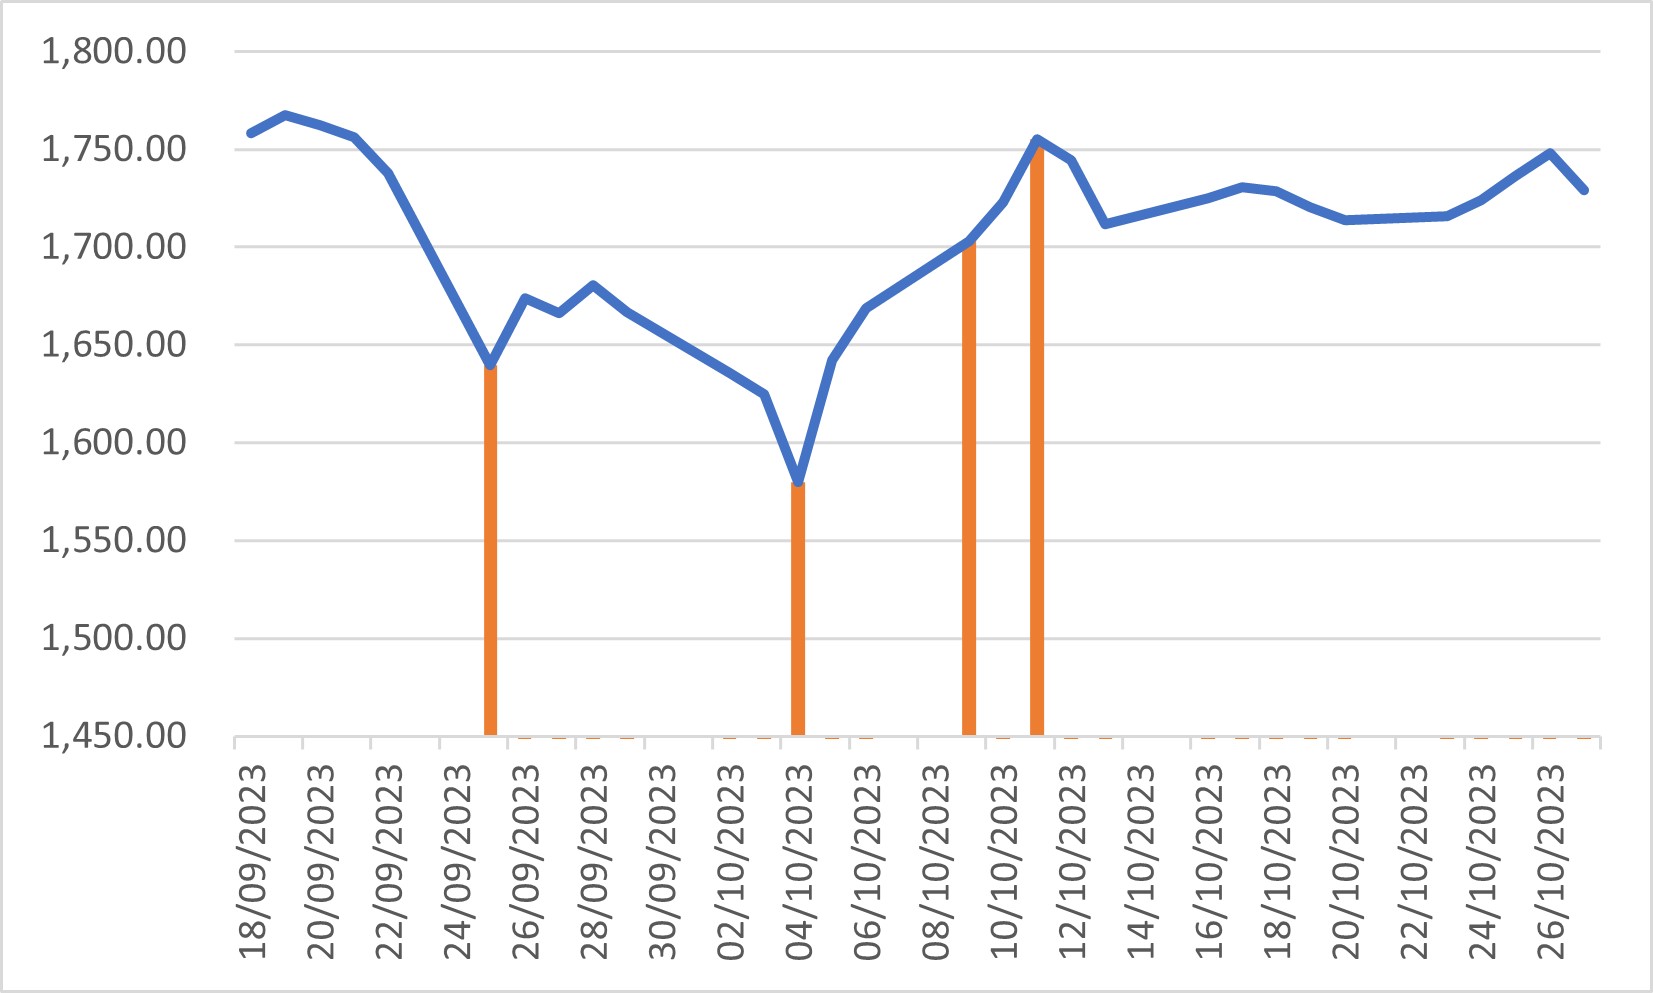
Let’s assume that you have a line graph showing stock movements. Every so often the stocks change direction and instead of fluctuating upwards, they start fluctuating downwards, or the other way round. A moment in time when this happens is called a turning point.
I was working on this problem and decided to insert a vertical line at every point that represents a turning point. Rather than doing it manually, I thought that it would make sense to pick up the values where such points occurred and automatically add them to my line graph with the stocks and shares values.
Although it sounds easy, in certain instances this can turn into a nightmare. This tutorial will give you all the tools you need to know to create such graphs without spending hours searching for the solution. To read the paper, just go here, and if you would like to see the Excel sheet, click here.