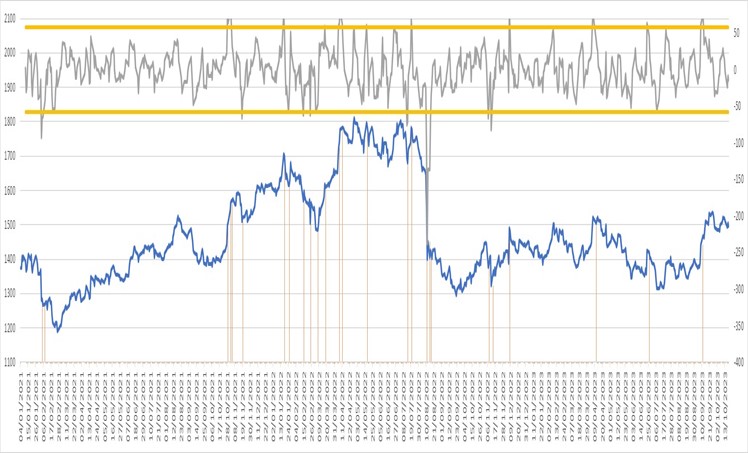
A turning point in stocks or shares, sometimes also known as an inflection point or pivot point, is a moment when a significant change in the direction of the stock movements takes place. To predict the future turning points is virtually impossible. However, to be able to predict that we are on the cusp of a turning point is possible.
Analysts and chartists use the concept of a pivot point with related support and resistance lines. I tried it and got confusing results. Perhaps it is me, but the approach was just not crisp enough. This prompted me to find a more solid approach, based exclusively on statistical methodology.
This page contains links to two papers and their associated spreadsheets. The first paper entitled "How to predict a turning point for stocks and shares – a classic approach" will remind you of how the analysts are currently approaching this challenge and the Excel sheet is available here. The second paper entitled "How to predict a turning point for stocks and shares - an alternative approach.pdf", introduces a new approach based on statistics. To download the associated Excel sheet, click here.