The fact that you are on this web page implies that you know what the autocorrelation (ACF) and partial autocorrelation (PACF) coefficients are. I am also assuming that you understand the relevance of the autocorrelation and partial autocorrelation functions. Then, why are you here? Probably because you are struggling to calculate them efficiently and elegantly.
This tutorial intends to address precisely that. We will not go into any theory, nor we’ll explain the applications for ACF and PACF. We’ll assume that you can get this elsewhere. However, we know that you are taught how to calculate the ACF and PACF manually, which is a very painful exercise. We also know that you might be referred to use this or that software package to calculate these coefficients. But what if you do not want to use either of the two approaches? What if you want to calculate them using some readily available platform, but with minimum effort?
This is why you came to this website. We will show you how to calculate both ACF and PACF using a simple Excel spreadsheet. We will not use macros, VBA or special functions. It is all done using a standard set of Excel functions squeezed into a single formula that can be entered into a first cell and then copied down to get all your ACF and PACF.
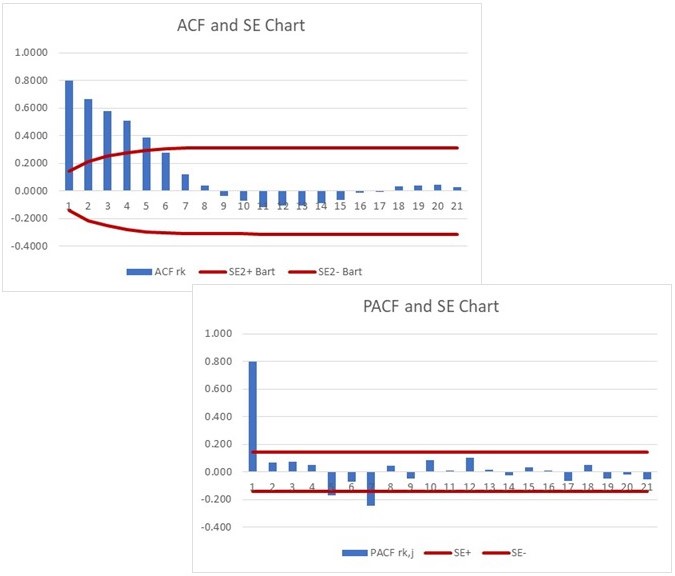
We’ll also show you how to calculate the standard errors (SE) for ACF and SE for PACF. And finally, in case you are not too proficient, we’ll demonstrate how to create proper ACF and PACF charts in Excel. That’s it. If you need a spreadsheet with all the calculations, you can access it in this place. For the pdf version of the tutorial go here.